Diagnostics and Transfer Functions
ffTRF exposes both lag-domain and frequency-domain views of a fitted model.
This page focuses on the spectral tools.
Raw Transfer Function
Use transfer_function_at(...) when you want the complex-valued frequency
response for one input/output pair:
frequencies, transfer = model.transfer_function_at(
    input_index=0,
    output_index=0,
)
The returned complex values encode both amplitude and phase.
Derived Transfer-Function Components
Use transfer_function_components_at(...) when you want the common derived
quantities in one container:
- magnitude
- unwrapped phase
- group delay
This is convenient when you want values for custom plotting or downstream analysis.
Transfer-Function Plotting
Use plot_transfer_function(...) for quick inspection:
kind="magnitude": show only magnitudekind="phase": show only phasekind="group_delay": show only group delaykind="both": show magnitude and phasekind="all": show magnitude, phase, and group delay
Group delay can be especially informative when you want to know whether the fitted mapping behaves like a delayed filter across frequencies rather than a single lag-domain peak.
Cross-Spectral Diagnostics
Use cross_spectral_diagnostics(...) when you want to compare the model's
predictions against observed targets in the frequency domain.
The returned container includes:
- predicted output spectra
- observed output spectra
- predicted-vs-observed cross-spectra
- magnitude-squared coherence
This is useful when a lag-domain kernel looks plausible but you still want to know whether the model captures the spectral structure of the target signal.
Coherence
plot_coherence(...) shows the magnitude-squared coherence between predicted
and observed targets for one output channel.
Interpretation:
- values near 1 indicate strong frequency-specific agreement
- values near 0 indicate poor agreement at those frequencies
Coherence is bounded, so it is often easier to compare across channels than raw spectral magnitudes.
Cross Spectrum
plot_cross_spectrum(...) shows the predicted-vs-observed cross spectrum for
one output channel.
- magnitude shows how strongly the prediction and observation covary by frequency
- phase shows whether they align or lag relative to each other in the spectral domain
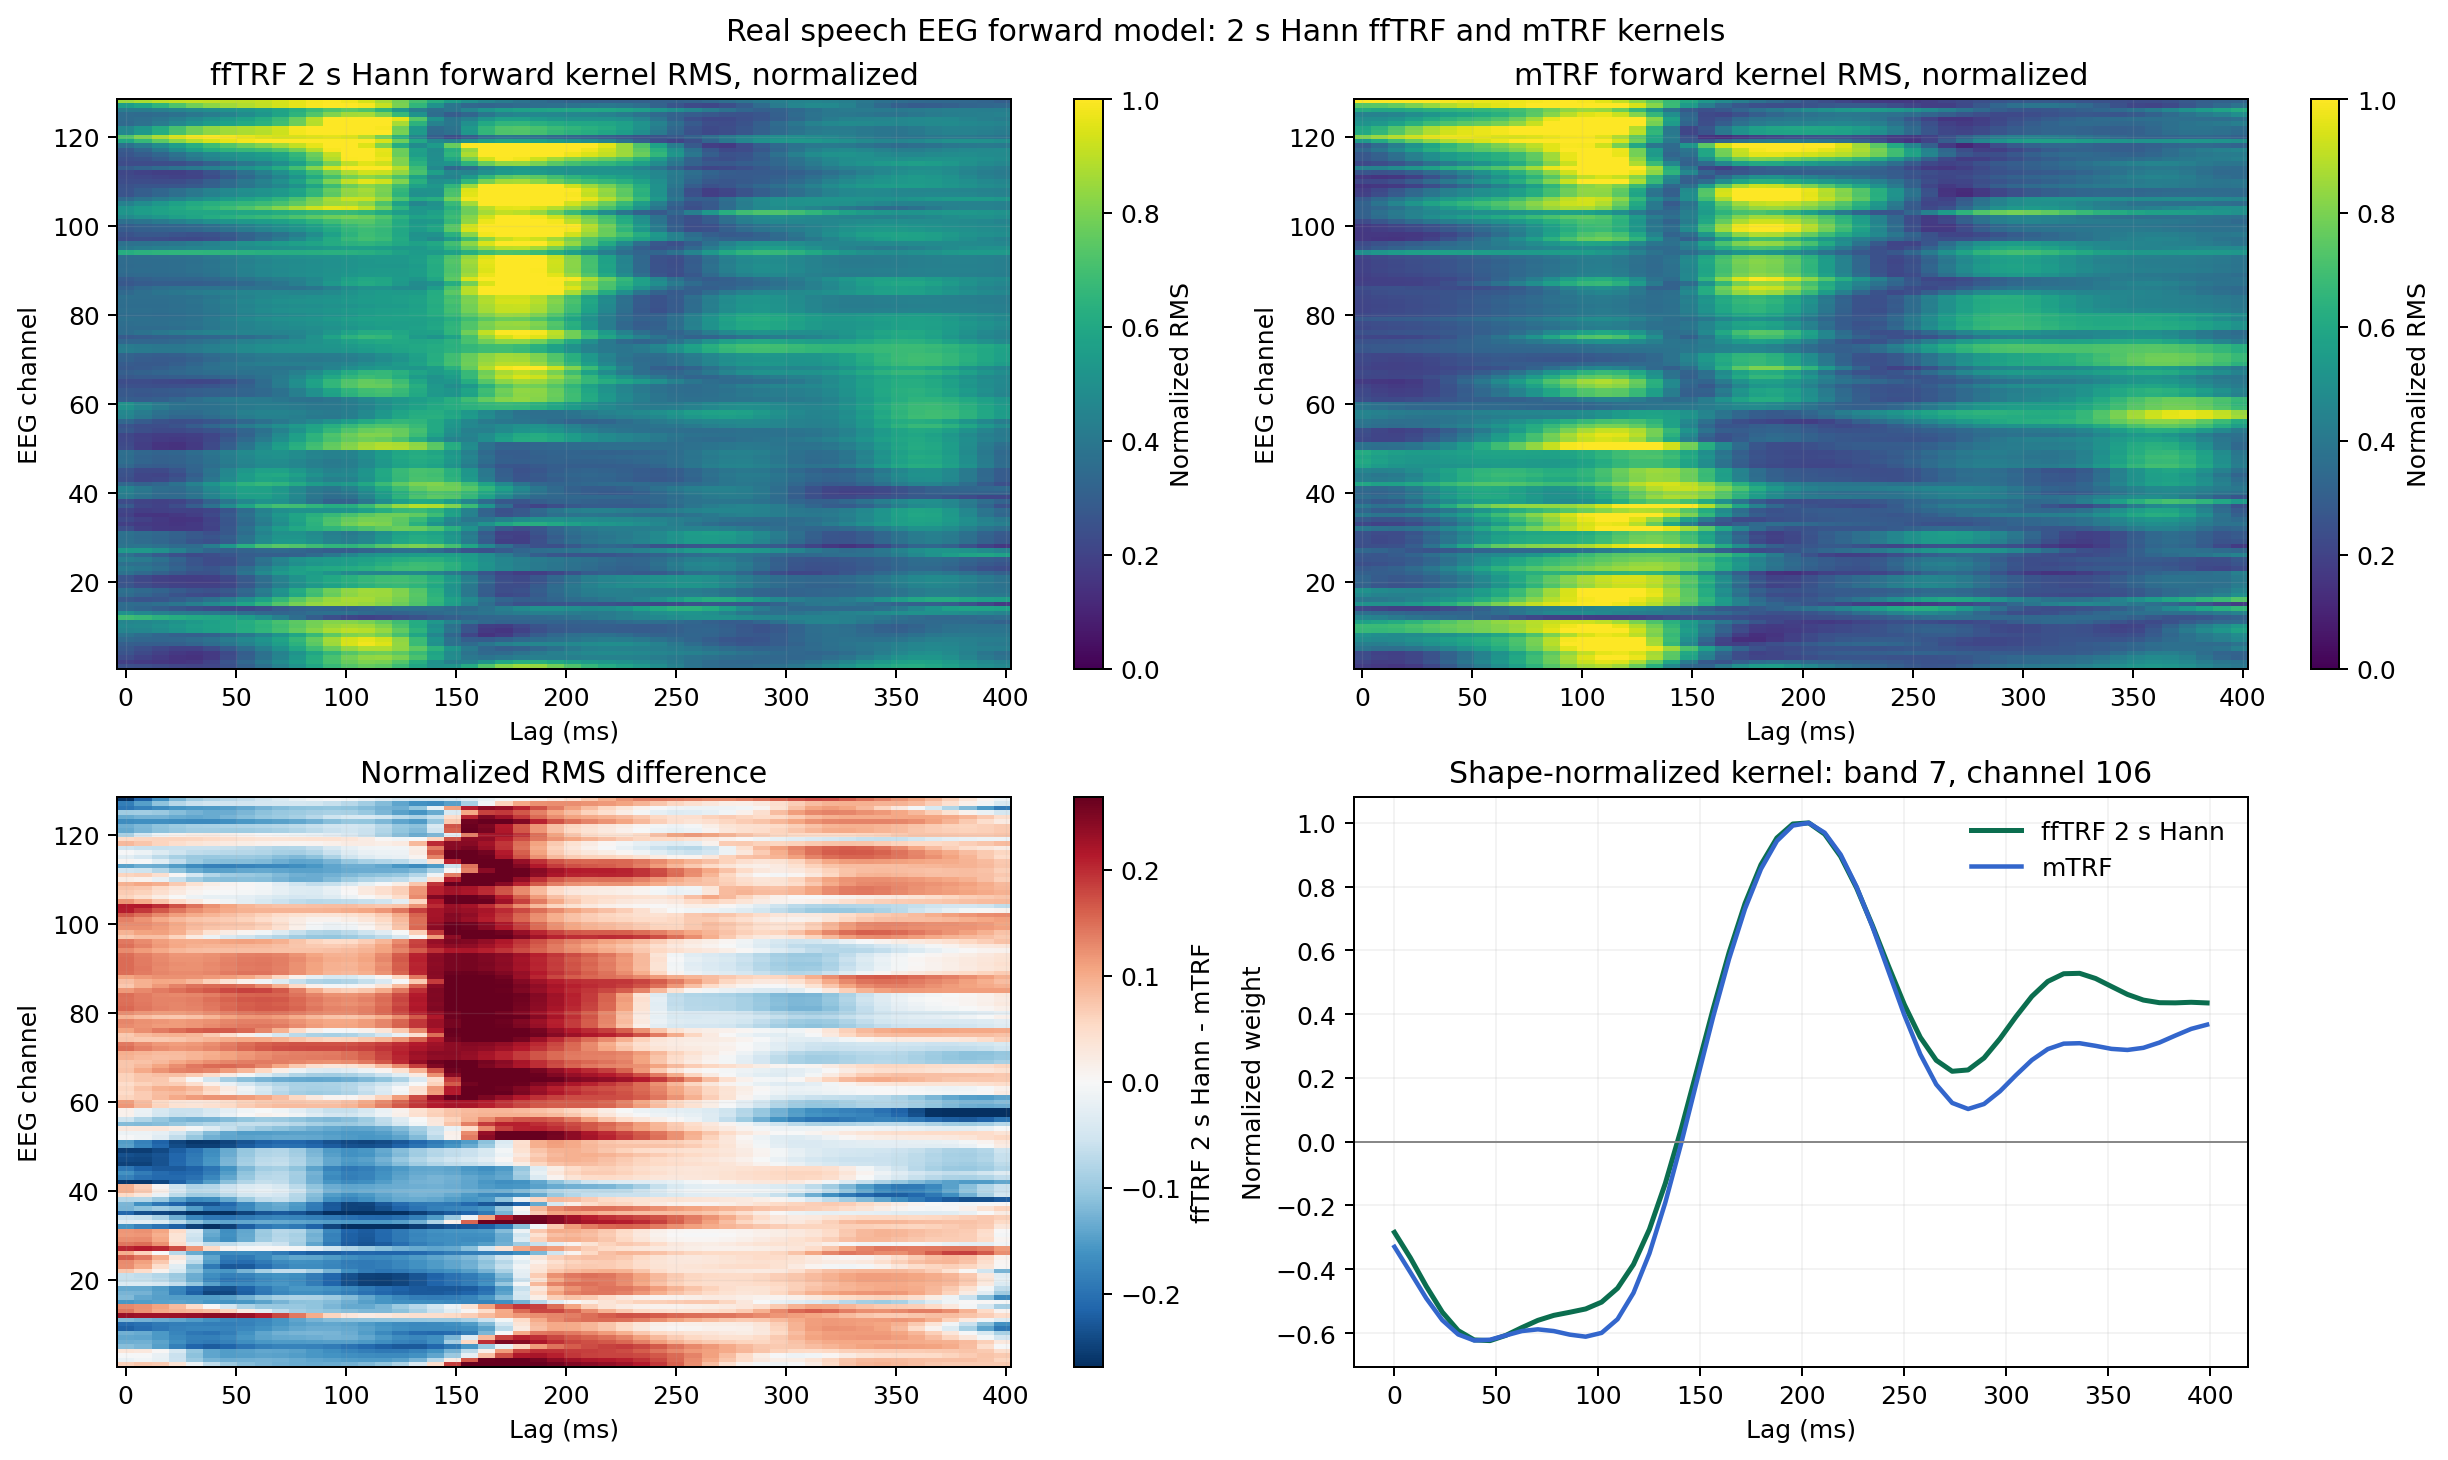
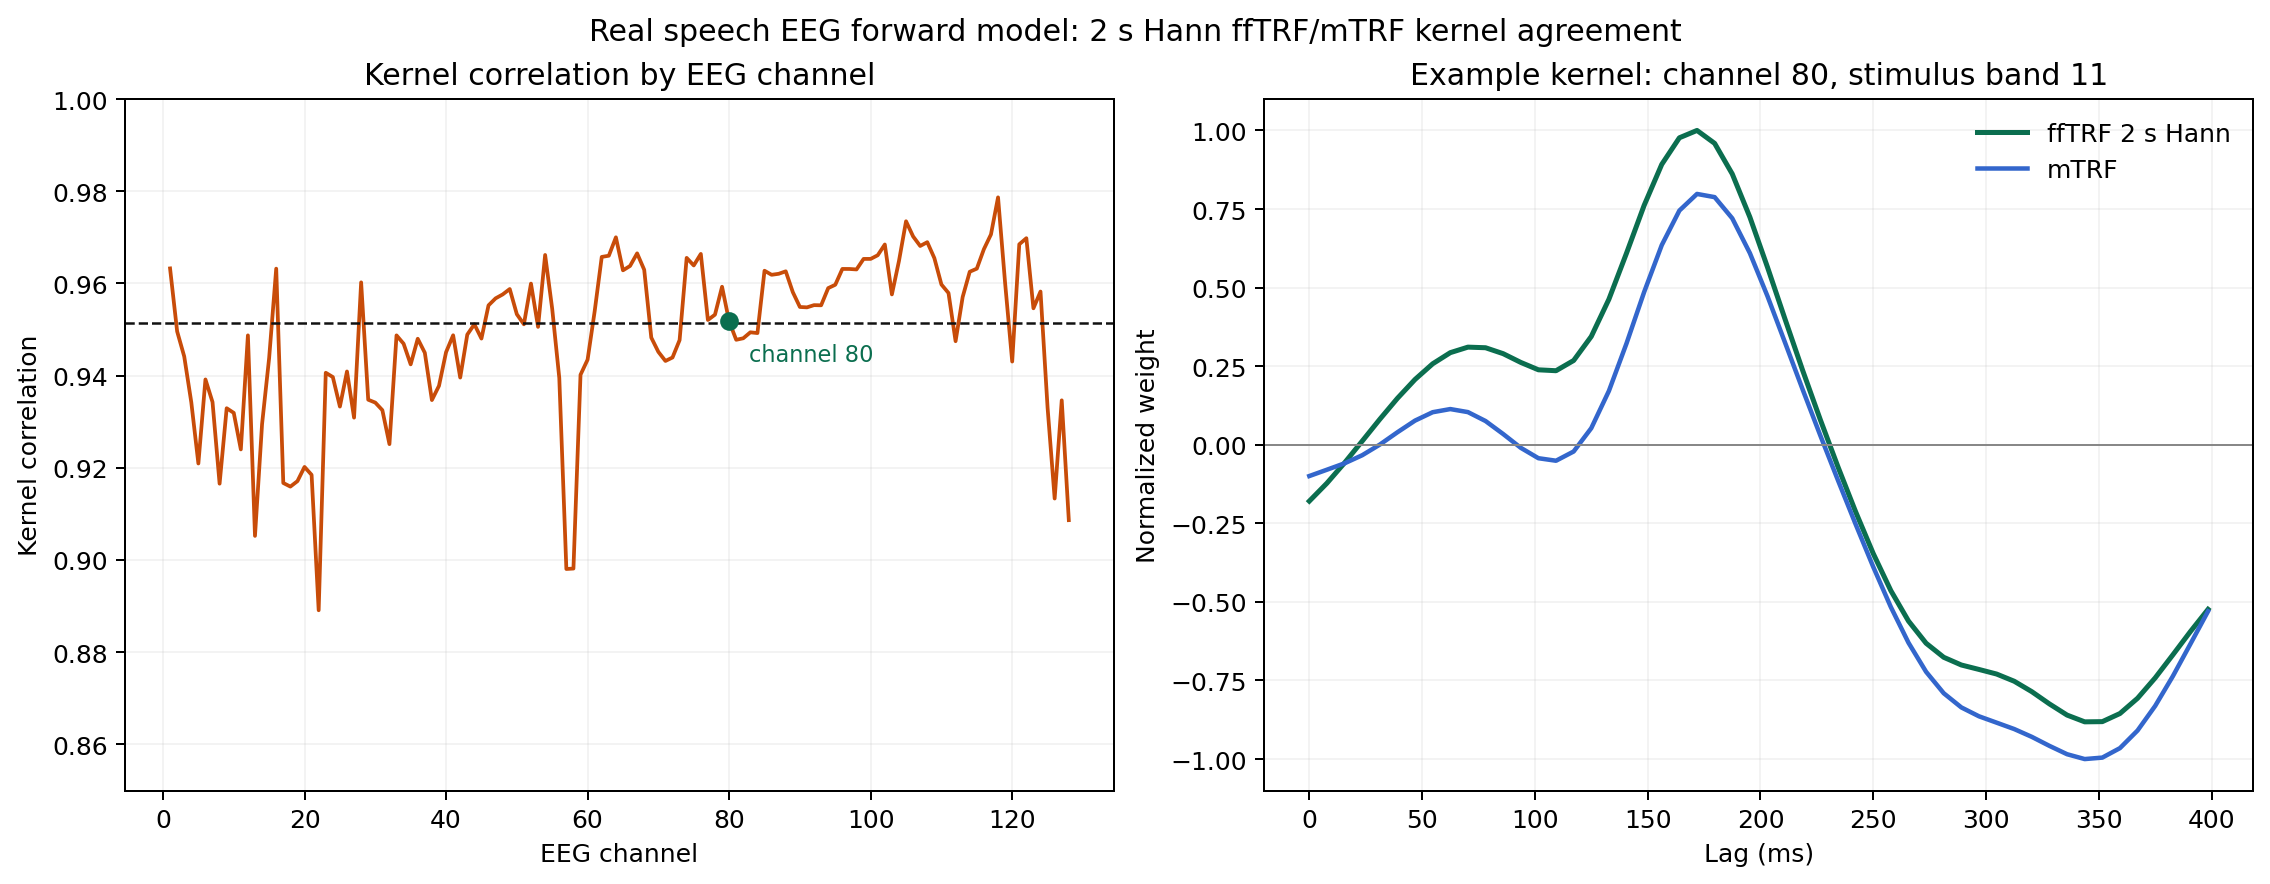
The public EEG comparison example in the repository is a useful sanity check for these diagnostics because it puts the recovered kernels next to a time-domain reference implementation.
The same run also summarizes kernel agreement across channels and lag samples:
When to Use Which Tool
- Use
plot(...)when you mainly care about lag-domain kernel shape. - Use
plot_transfer_function(...)when you care about gain and phase. - Use
plot_coherence(...)when you care about prediction quality by frequency. - Use
plot_cross_spectrum(...)when you want a fuller spectral relationship between predictions and observed targets.